jcmd – GC.class_histogram

All

Using a fast approach to see the heap

Sometimes taking a heap dump will be too long for the production environment, on this cases, it is possible to wait for the load to reduce and then take the heap dump.

However, it is possible to use the quick java diagnostics tool to see the some quick information. Basic usage is just run jcmd, and then see the processes running get the name or PID, then jcmd PID help. To see the operations available, in JDK 11+ there are so many operations that can be done, like jcmd PID VM.metaspace

If one does `GC.class_histogram`, which does not depend of +UnlockDiagnosticVMOptions, it can see the list of instances and retention based on the heap usage, example <— like seriously you don’t need to use it

GC.class_stats$ jdk-11.0.1/bin/jcmd 1568 GC.class_histogram
 1568:
  num     #instances         #bytes  class name
 1:       2725548       87217536  java.util.HashMap$Node
    2:        101237       56724056  [B
    3:       2706313       43301008  org.infinispan.server.some.Class <--- some clas takes 433k bytes, so then 43mb
    4:         13443       17843296  [Ljava.util.HashMap$Node;
    5:         21725       16866280  [Ljava.lang.Object;
    6:          8658        5679648  io.netty.util.internal.shaded.org.jctools.queues.MpscArrayQueue
    7:         62530        5015664  [C
    8:         79376        2540032  java.util.concurrent.ConcurrentHashMap$Node

So we can see that the class `org.infinispan.server.some.Class` takes 2706313bytes, so 27mb of the heap, very easily.

This is a very powerful and pretty simple, you can use jcmd to get a heap dump with: `jcmd PID GC.heap_dump` but then you need to set a tool to analyse the Heap itself, like MAT.

Of course this quick usage is not for beginners, you need to know a bit of your application/stack so then one can see how it gets some data. But for a quick investigation it is pretty useful.

JCMD GC histogram

Just be careful with the histogram ( I will write a blog post specifically about it) but basically the histogram would only show memory directly used by those classes. Not all the other memory retained in their graph. So for instance, you’d see a lot of individual objects, but wouldn’t see that one particular collection is using 90% of the heap –> can lead to false positives. But it is really helpful for those scenarios that heap is not that possible and you have a clear knowledge of what you doing and can investigate the code if necessary. Histogram will perform Full GC operation btw.

The example below shows that, you think is the actual object that is taking 244 mb but there is a major object used by Infinispan/DataGrid for cache processing that holds it:

 num     #instances         #bytes  class name (module)
-------------------------------------------------------
   1:        505686      856288432  [B (java.base@11.0.12)
   2:        808426      806075760  [Ljava.lang.Object; (java.base@11.0.12)
   4:        765492       24495744  io.netty.buffer.PoolThreadCache$SubPageMemoryRegionCache <-------- 244 mb
   5:        333316       15999168  java.util.concurrent.locks.StampedLock (java.base@11.0.12)
   6:        394052       15762080  java.util.WeakHashMap$Entry (java.base@11.0.12)
   7:        138136       12155968  io.netty.buffer.PooledUnsafeDirectByteBuf
   8:        309118        9891776  io.netty.util.Recycler$DefaultHandle
   9:        386970        9287280  java.lang.String (java.base@11.0.12)
  10:        115820        9264848  [Ljava.util.HashMap$Node; (java.base@11.0.12)
Total       7081360     2396918072 <------------------------------ 2.4 gb

I will be presenting some quick jcmd usage in a conference: TDC. This is my second time presenting at the TDC and I’m very glad to share my knowledge on jcmd and live gc observations. In 2014 went to Florianopolis to present about EEG but now I will be presenting in Porto Alegre, RS, Brazil:

TDC 2020 Porto Alegre

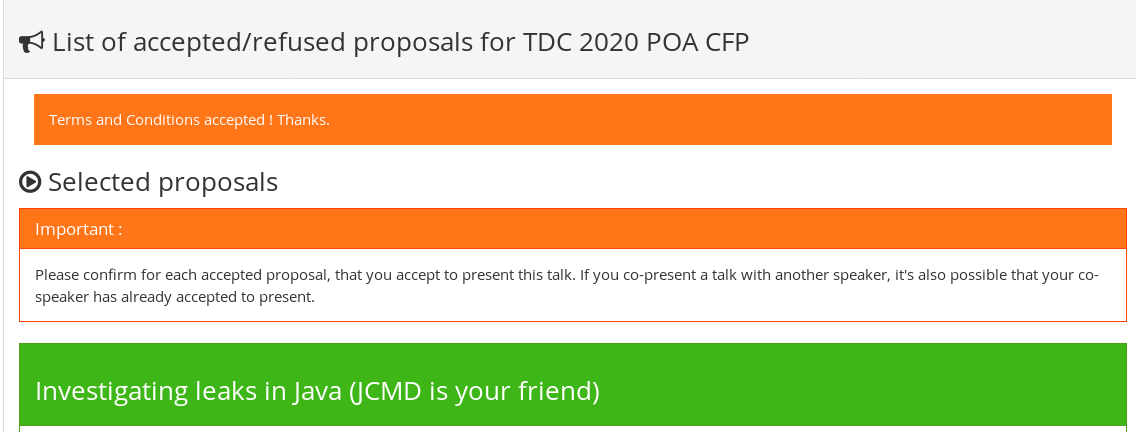
I will add slides/presentation here and some extra comments right after, of course.

Update: I’ve been using more and more jcmd PID VM.info particularly for containers’ investigation context. It is really good and useful and it brings the native allocation as well. I will do a blog post about it.

Protocol buffers

All

Google’s mechanism for data serialization, Protocol Buffers language neutral. There are three versions of the protocols: proto2, proto3.

Proto

Proto is the abbreviation of the file but also is the name of the protocol.

Message

Defining a (using .proto file)

message SearchRequest { <-- similar to python:: define message `SearchRequest`
  required string query = 1;
  optional int32 page_number = 2;
  optional int32 result_per_page = 3;
}

Advantages

> Fast ~ binary

> Lightweight ~ binary 😀

> Language independent (if you are prototyping in python and implementing in java)

Benchmarks

An example of Protobuf tutorial, given by Ten Loh, where he does a comparison of JSON parsing and Protobufs.

Protostream

On Infinispan/Data Grid, to develop custom Protostream as default serialization mechanism, this replaces the JBoss Framework.

For customization, there are two possibilities on DG:

1. Generate one given that the serializable classes have the proper annotation (@ProtoField and/or @ProtoFactory). To automatically generate it, one relies Data Grid `protostream-processor` (after adding the proper annotations) that on compile time generate the .proto file.

2. OR you manually  implement a proto message buffer

jcmd baseline

All

I would like to know exactly where the JVM is spending the memory, almost bit by bit! how to do so?

I already mentioned jcmd on my previous reply. But now, I will show this feature to actually take an compare baselines:

$ jcmd 26283 VM.native_memory 26283: Native Memory Tracking: Total: reserved=3075884KB, committed=1815600KB - Java Heap (reserved=1335296KB, committed=1335296KB) (mmap: reserved=1335296KB, committed=1335296KB) - Class (reserved=1149983KB, committed=118375KB) (classes #20513) (malloc=3103KB #30610) (mmap: reserved=1146880KB, committed=115272KB) - Native Memory Tracking (reserved=5453KB, committed=5453KB) <--- Native memory (malloc=255KB #3577) (tracking overhead=5198KB)

Generating diff:

$ jcmd 26283 VM.native_memory detail.diff 
26283:
Native Memory Tracking: Total:
reserved=2984385KB +296KB, committed=1725525KB +296KB -
Java Heap (reserved=1335296KB, committed=1335296KB) (mmap: reserved=1335296KB, committed=1335296KB) -
Native Memory Tracking (reserved=5572KB +79KB, committed=5572KB +79KB) <--- this means that +79Kb were added
(malloc=348KB +63KB #4926 +890) (tracking overhead=5224KB +16KB)

This means that 79Kb were added tot eh native tracking and using a simple baseline one can see even how much the GC increased/decreased the usage.

GC (reserved=135778KB, committed=66846KB)
(malloc=24654KB #37248)
(mmap: reserved=111124KB, committed=42192KB +79KB)

Compiler (reserved=1142KB, committed=1142KB +79KB)
(malloc=1033KB #1307)
(arena=110KB #5)

jcmd

All

If one needed to learn/use JUST ONE tool when working with java (not a GUI tool, like Jconsole or JvisualVM) it would be jcmd (MacDonald’s tools, ask it will give you):

$ jcmd <-- list processes
4131 sun.tools.jcmd.JCmd
19353 /home/fdemeloj/jboss-eap-7.2//jboss-modules.jar -mp /home/fdemeloj/jboss-eap-7.2//modules org.jboss.as.standalone -Djboss.home.dir=/home/fdemeloj/jboss-eap-7.2/ -Djboss.server.base.dir=/home/fdemeloj/jboss-eap-7.2//standalone <-- jboss

list all possible features on specific PID:

$ jcmd 19353 help
19353:
The following commands are available:
VM.native_memory
ManagementAgent.stop
ManagementAgent.start_local
ManagementAgent.start
GC.rotate_log
Thread.print <-- thread dump
GC.class_stats
GC.class_histogram
GC.heap_dump
GC.run_finalization
GC.run
VM.uptime
VM.flags <-- VM flag
VM.system_properties <-- system properties
VM.command_line
VM.version <- version
help
For more information about a specific command use 'help '.

JVM version on the spot:

$ jcmd 19353 VM.version
19353:
OpenJDK 64-Bit Server VM version 25.161-b14
JDK 8.0_161

Thread dumps:

$ jcmd 19353 Thread.print
19353:
2020-10-13 12:57:03
Full thread dump OpenJDK 64-Bit Server VM (25.161-b14 mixed mode): <--the jvm version
#And the list of threads below
"Attach Listener" #176 daemon prio=9 os_prio=0 tid=0x0000000003505060 nid=0x4d3b waiting on condition [0x0000000000000000]
java.lang.Thread.State: RUNNABLE
"ServerService Thread Pool -- 95" #175 prio=5 os_prio=0 tid=0x00000000071fa4d0 nid=0x4cf0 waiting on condition [0x00007fd86dcf3000]
java.lang.Thread.State: WAITING (parking)
at sun.misc.Unsafe.park(Native Method)
- parking to wait for <0x00000000ae808ad8> (a java.util.concurrent.locks.AbstractQueuedSynchronizer$ConditionObject)
at java.util.concurrent.locks.LockSupport.park(LockSupport.java:175)
at java.util.concurrent.locks.AbstractQueuedSynchronizer$ConditionObject.await(AbstractQueuedSynchronizer.java:2039)
at java.util.concurrent.ScheduledThreadPoolExecutor$DelayedWorkQueue.take(ScheduledThreadPoolExecutor.java:1088)
at java.util.concurrent.ScheduledThreadPoolExecutor$DelayedWorkQueue.take(ScheduledThreadPoolExecutor.java:809)
at java.util.concurrent.ThreadPoolExecutor.getTask(ThreadPoolExecutor.java:1074)
at java.util.concurrent.ThreadPoolExecutor.runWorker(ThreadPoolExecutor.java:1134)
at java.util.concurrent.ThreadPoolExecutor$Worker.run(ThreadPoolExecutor.java:624)
at java.lang.Thread.run(Thread.java:748)
at org.jboss.threads.JBossThread.run(JBossThread.java:485)

Using just jmcd one can basically compare and even confirm there is a leak and where the leak occurs.

$ jcmd 5492 VM.native_memory
5492:
Native Memory Tracking:
Total: reserved=2987852KB, committed=1727872KB
Java Heap (reserved=1335296KB, committed=1335296KB)
(mmap: reserved=1335296KB, committed=1335296KB)
Class (reserved=1151986KB, committed=118666KB)
(classes #20430)
(malloc=3058KB #30925)
(mmap: reserved=1148928KB, committed=115608KB)
Thread (reserved=96759KB, committed=96759KB)
(thread #95)
(stack: reserved=96524KB, committed=96524KB)
(malloc=125KB #482)
(arena=110KB #188)
Code (reserved=254842KB, committed=30790KB)
(malloc=5242KB #8293)
(mmap: reserved=249600KB, committed=25548KB)
GC (reserved=105512KB, committed=105512KB)
(malloc=23192KB #17603)
(mmap: reserved=82320KB, committed=82320KB)

But of course, combined with a `jinfo`, this can be very powerful (i.e. change the JVM runtime behavior) easily:

XX:CICompilerCount=4 -XX:ConcGCThreads=2 -XX:G1HeapRegionSize=1048576 -XX:GCLogFileSize=3145728 -XX:InitialHeapSize=1367343104 -XX:MarkStackSize=4194304 -XX:MaxHeapSize=1367343104 -XX:MaxMetaspaceSize=268435456 -XX:MaxNewSize=819986432 -XX:MetaspaceSize=100663296 -XX:MinHeapDeltaBytes=1048576 -XX:NumberOfGCLogFiles=5 -XX:+PrintGC -XX:+PrintGCDateStamps -XX:+PrintGCDetails -XX:+PrintGCTimeStamps -XX:-TraceClassUnloading -XX:+UseCompressedClassPointers -XX:+UseCompressedOops -XX:+UseG1GC -XX:+UseGCLogFileRotation
[fdemeloj@fdemeloj red-irc]$ jinfo -flag -PrintGCDetails 14865
[fdemeloj@fdemeloj red-irc]$ jcmd 14865 VM.flags
14865:
-XX:CICompilerCount=4 -XX:ConcGCThreads=2 -XX:G1HeapRegionSize=1048576 -XX:GCLogFileSize=3145728 -XX:InitialHeapSize=1367343104 -XX:MarkStackSize=4194304 -XX:MaxHeapSize=1367343104 -XX:MaxMetaspaceSize=268435456 -XX:MaxNewSize=819986432 -XX:MetaspaceSize=100663296 -XX:MinHeapDeltaBytes=1048576 -XX:NumberOfGCLogFiles=5 -XX:+PrintGC -XX:+PrintGCDateStamps -XX:-PrintGCDetails -XX:+PrintGCTimeStamps -XX:-TraceClassUnloading -XX:+UseCompressedClassPointers -XX:+UseCompressedOops -XX:+UseG1GC -XX:+UseGCLogFileRotation

With a simple GC.class_histogram, one can see the details of the number of instances per class:

$ jcmd 10197 GC.class_histogram
10197:
num #instances #bytes class name
1: 164217 20851032 [C
2: 240025 7680800 java.util.HashMap$Node
3: 162967 3911208 java.lang.String
4: 21784 3194040 [Ljava.util.HashMap$Node;
5: 46342 2609232 [Ljava.lang.Object;
6: 21603 2429160 java.lang.Class
7: 17678 1697088 java.util.jar.JarFile$JarFileEntry
8: 5805 1013840 [B
9: 20079 963792 java.util.HashMap
10: 16127 645080 java.util.LinkedHashMap$Entry
11: 19221 615072 org.jboss.vfs.spi.JavaZipFileSystem$ZipNode <--- zipnode always there!

Sure, jstat, jhat … several others have their intentions and usefulness, just watching the generations with jstat I think is a pretty good deal.

$jdk1.8.0_191/bin/jstat -gc 14512 10000 30
S0C S1C S0U S1U EC EU OC OU MC MU CCSC CCSU YGC YGCT FGC FGCT GCT
18944.0 17920.0 224.0 0.0 408064.0 75522.4 890368.0 32466.4 72576.0 64107.4 10368.0 8014.6 28 0.191 2 0.147 0.338

I will talk about talking a baseline on the next post.